

Customer Concentration Considerations
CoreWeave’s customer relationships appear impressive, with the S-1 referencing relationships with notable organizations including Cohere, IBM, Meta, Microsoft, Mistral, and NVIDIA. However, revenue concentration metrics present a more nuanced picture.
According to the S-1, CoreWeave recognized approximately 41% and 73% of its revenue from its top three customers for the years ended December 31, 2022, and 2023, respectively. For 2024, approximately 77% of revenue came from just the top two customers, with the largest customer accounting for 62% of FY2024 revenue—up from 35% in FY2023 and 16% in FY2022.
This concentration pattern suggests potential revenue stability considerations, particularly if major customers eventually transition workloads to first-party data centers, despite recent public statements from technology executives supporting external infrastructure models. There also exists a longer-term possibility that major technology companies might reassess capital expenditure patterns if return on investment metrics remain unclear. While this scenario appears less probable given current spending patterns, it represents a potential future consideration.
CoreWeave highlights revenue visibility through $15.1 billion in remaining performance obligations (RPOs) as of December 31, 2024 (up from $9.9 billion the previous year) and through an average contract duration of approximately 4 years. While near-term revenue visibility appears strong, medium-term revenue dynamics may face greater uncertainty given both current market momentum and customer concentration factors.
From a supplier perspective, CoreWeave sources GPUs exclusively from Nvidia, creating a single-source supply arrangement.
Asset Economic Considerations
CoreWeave’s margin structure warrants deeper examination beyond surface-level metrics. The company’s reported gross margin includes costs of running data centers (rent, cooling, electricity) and hosting expenses. However, the core infrastructure components—GPUs—are recorded as capital expenditures and are not directly reflected in the P&L.
The S-1 indicates these assets are “depreciated over a 6-year period.” This accounting treatment merits consideration when evaluating true economic returns, particularly given the pace of innovation in AI hardware. EBIT (rather than EBITDA) likely provides a more complete indicator of operating performance as it captures the depreciation of these assets.
A comprehensive view of economic margins might consider:
Adjustments for GPU depreciation schedules relative to technological innovation cycles
Complete infrastructure management costs
The impact of financing arrangements on overall returns (interest payments represented approximately 19% of FY2024 revenue)
Beyond GPUs, a comprehensive margin analysis would benefit from greater visibility into infrastructure deployment costs, operational management expenses, and the impact of real estate arrangements on overall economics.
Our assessment suggests three economic margin metrics would enhance analytical clarity:
A normalized gross margin incorporating appropriate GPU depreciation
A comprehensive operating margin, including complete infrastructure management costs
A perspective that normalizes for owned versus leased facility impacts
The S-1 reports “Technology & Infrastructure” expenses at approximately 50% of revenue in FY2024, but provides limited visibility into R&D investment components despite frequent references to software capabilities (the term “software” appears 180 times in the filing).
Sales and marketing expenses are notably low at less than 1% of FY2024 revenue, while general and administrative expenses account for approximately 6% of revenue.
Given CoreWeave’s business model, free cash flow represents a critical performance indicator, as capital expenditures significantly impact overall returns.
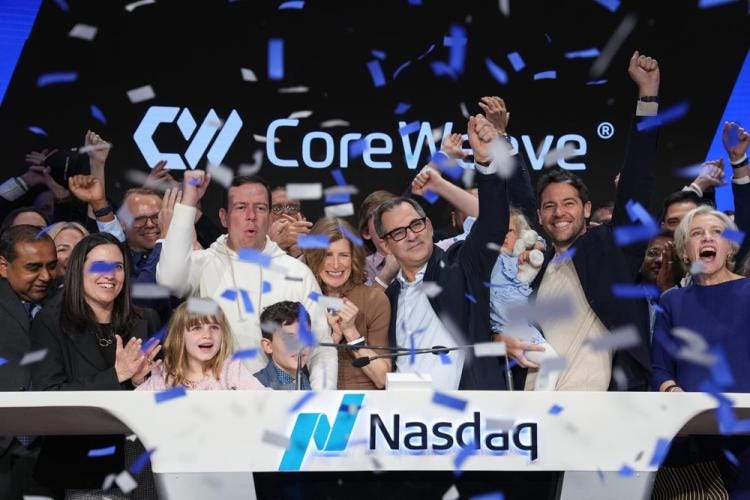
CoreWeave’s filing of its S-1 on March 3 triggered significant market interest as one of the first generative AI infrastructure companies to seek an IPO. The company’s evolution from niche bitcoin miner to a prominent player in the GenAI infrastructure economy captured widespread attention from media and investors, seemingly positioned to validate the potential value of this transformative technology.
Initial market reaction focused on the company’s growth metrics, with many observers highlighting “sharp growth” and “revenue surges.” Early market expectations suggested CoreWeave would seek to raise approximately $4 billion at a valuation of around $35 billion.
Our analysis, however, indicated potential challenges to this valuation thesis based on several structural considerations.
Our DGI framework suggested CoreWeave would likely face valuation challenges relative to initial expectations. Subsequent market developments aligned with aspects of this assessment, as the company adjusted its offering to raise approximately $1.5 billion at $40 per share—below the initial $47-55 per share range.
Important Disclaimer
This post contains opinion and analysis based on publicly available information, primarily CoreWeave’s S-1 filing. In this analysis, the author is not providing investment advice or recommendations to buy, sell, or hold any securities. This analysis represents the author’s personal views and analytical framework only. All factual statements are derived from public information, primarily CoreWeave’s S-1 filing.
The content presents an analytical methodology for evaluating technology companies during periods of technological discontinuity. Readers should conduct their own research and consult with financial advisors before making any investment decisions. Recent stock price movements may reflect various market factors beyond those analyzed in this document.
The author has no position in CoreWeave securities and no intention to establish a position within 72 hours of publishing this analysis.
Editorial note, September 2026. This analysis was published on 3 April 2025 and is preserved as written. CoreWeave has since appeared in two later pieces: its absence from Coatue’s Fantastic 40, and NVIDIA’s $6.3 billion guarantee against its unused capacity.