


Part 3 in the series after The Hyperscaler Reckoning (5 May) and The Hyperscaler Dispersion (4 August).
TL;DR: Alphabet, Amazon, Meta, and Microsoft reported about $203 billion of Q3 2026 capex on company-specific measures. Only Microsoft’s operating cash flow exceeded capex. My central case keeps their combined free cash flow negative through 2029, with recovery in 2030 if capex growth slows. That’s two years later than the chart investors still carry. Why is my projection further out? Cloud growth is accelerating, the core businesses that pay for it are showing the first signs of AI substitution, and disclosed commitments from two laboratories, OpenAI and Anthropic, equal close to 40% of the cloud backlog. The AI buildout is funded. The cash payoff may wait until 2030.
Methodology note: The cash-flow path in this essay is built from the companies’ own numbers: the third-quarter cash-flow statements, the 2026 capex guides, and what management said on the calls about 2027, with two growth assumptions of my own. This is not a model or a consensus. It is a set of high-level estimates, rounded to the nearest $10bn, meant to show the shape and the timing of the recovery rather than to forecast a year. Backlog and commitment figures are from the 10-Qs, the earnings calls, and Anthropic’s prospectus; OpenAI’s are as reported.
The promise of AI is an economy where cognition is cheap, and agents can do more of the work. Late last week, markets confronted the cost of building it. And the reckoning was brutal.
Following Alphabet’s Q3 earnings call on Thursday, the company’s shares fell 12.6%, their worst day since the company listed in 2004, after the company reported negative free cash flow of $9.1 billion and quarterly capital spending above $51 billion. The same quarter brought Google Cloud revenue of $30.7 billion, more than double the prior year, and a cloud backlog of roughly $561 billion.
Amazon shares fell more than 6% in after-hours trading after its Q3 results showed trailing 12-month free cash flow had swung to negative $42.4 billion, largely as purchases of property and equipment rose with AI investment.
Demand has not disappeared, but demand alone no longer answers the market’s most urgent question: Can companies turn AI into cash quickly enough to pay for the infrastructure being built to serve it?
In AGNT: The Orchestration Economics Manifesto, I argue that as cognition becomes cheaper, value shifts toward orchestration: coordinating AI agents inside real workflows. But for that to happen, chips, data centers, and power must be financed before that value emerges.
Right now, hyperscalers are paying for that transition through historic capital expenditures that keep blowing past forecasts. Despite investor hand-wringing, these companies have no choice but to keep increasing the money they put into compute for years to come. Frontier models require more capacity. And as agentic systems are deployed, the volume of inference required is rising steeply.
These companies have an insatiable demand for compute. And even as this appetite grows, the core business providing the revenue to sustain it shows signs of being cannibalized.
An industry that is spending so massively that cash flow is turning structurally negative, while the core business erodes, is a combination no balance sheet sustains for long.
All of this is complicated by the concentrated exposure to OpenAI and Anthropic. As I and many others have noted, these two companies are at the heart of vast financial ecosystems that now depend on their success. Reports that OpenAI had about $11 billion committed against a $30 billion target, and has since lowered the target to about $20 billion, will not help with those jitters. And while Anthropic is in a much stronger financial position as it pushes toward an IPO expected as soon as this month, Blackstone’s expectation that its debt will be rated double-B means clouds will remain over its public offering.
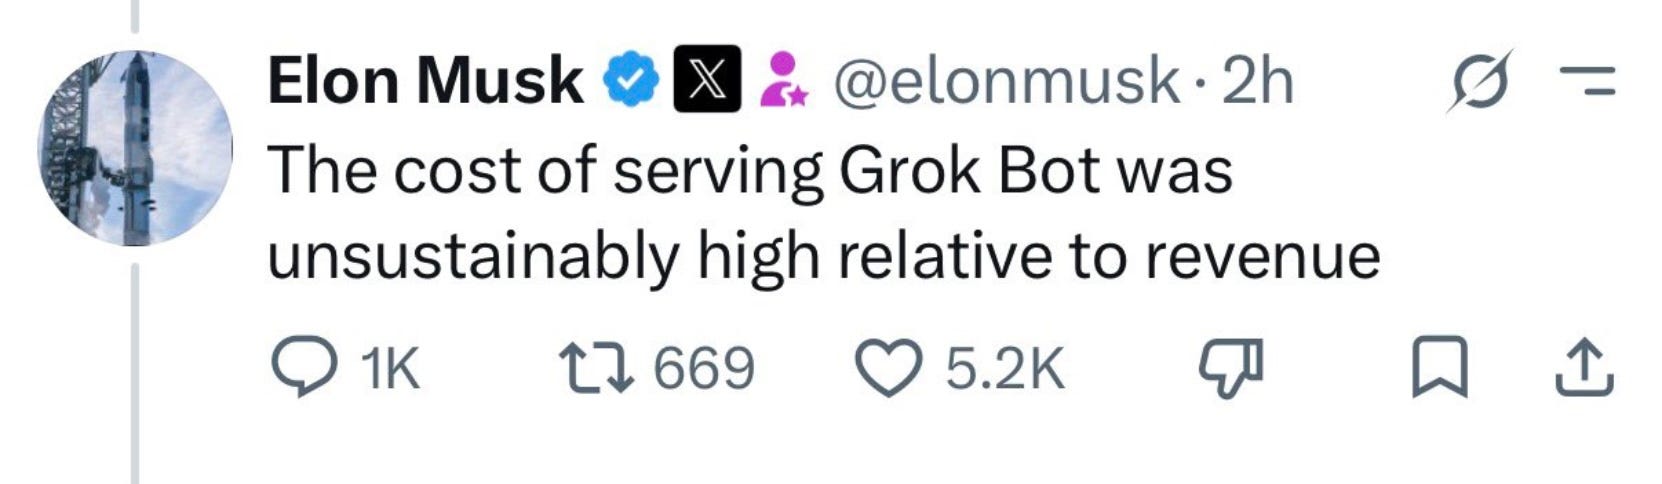
Even Elon Musk, fresh from June’s SpaceX listing, whose prospectus leaned on xAI’s $1.25bn-a-month contract to supply Anthropic with the whole of its Colossus 1 data center in Memphis, offered a grim explanation on 1 November when a subscriber asked for Grok Bot’s limits to be reset: “The cost of serving Grok Bot was unsustainably high relative to revenue.”
What is at stake is more than whether four hyperscalers spend too much in one year.
The Commerce Department’s first estimate for the third quarter, published on 29 October, put growth at 3.4% annualized, with the increase in investment led by inventories and information-processing equipment, mainly computers. This spending is distorting supplies and prices, with Apple guiding its December-quarter gross margin down to 45-46% on 2 November, “primarily” on higher memory costs, days after OpenAI’s Sam Altman told the Cheeky Pint podcast that it was “quite terrible” for the world’s limited DRAM to sit in personal computers used 5% of the time.
Right now, investors hold onto an optimistic belief that the industry will get through this turbulence to reach an inflection point in 2028, when revenue will begin to climb past spending and a sustainable equilibrium will be achieved. I disagree. My path, built from the companies’ own run rate and guidance, keeps the four largest hyperscalers’ combined free cash flow near −$130bn in 2028 and about −$40bn in 2029; positive cash in 2030 requires capex growth to slow to single digits, or cash generation to run at the rate the companies reported this year.
The problem with both projections is that they require more than calculating revenue against capex spending. The details of infrastructure financing, such as timing and terms, are just as important as the spending amounts. We have varying degrees of visibility into these details.
In this essay, I want to walk through the steps I used to build that path. I start with the chart investors still carry, then the companies’ own filings, then the two assumptions I add on top.
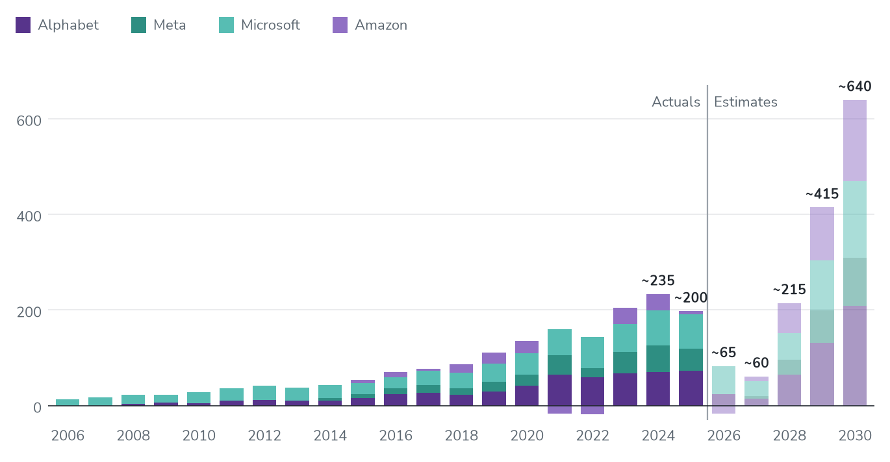
The hyperscaler cash-flow curve turns on 2028
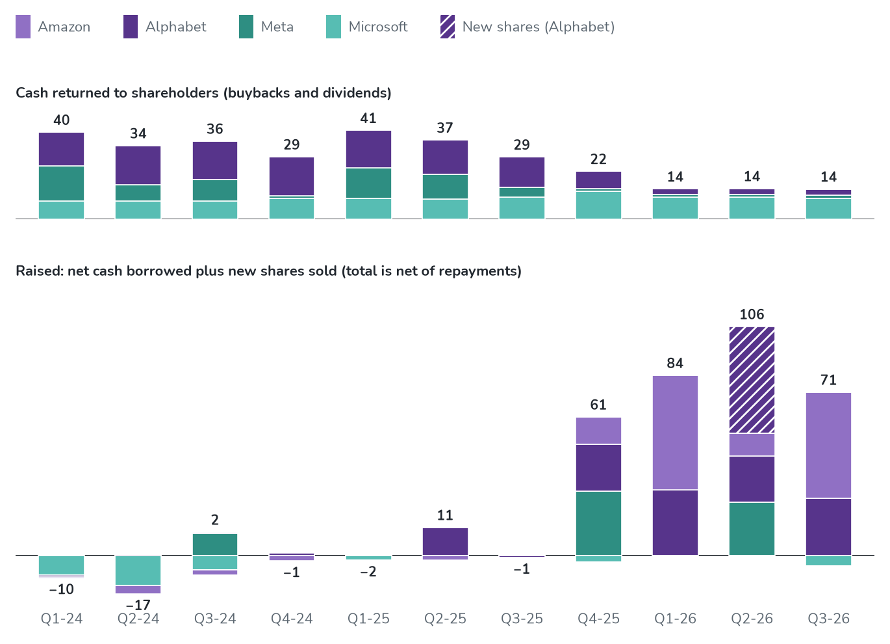
The four hyperscalers spent a combined $203bn in the third quarter. On the companies’ reported measures, capex exceeded operating cash flow at Alphabet, Amazon and Meta; Microsoft was the exception. The group still generated roughly $60bn of free cash flow over the trailing twelve months, but its combined cash flow turned negative in the quarter.
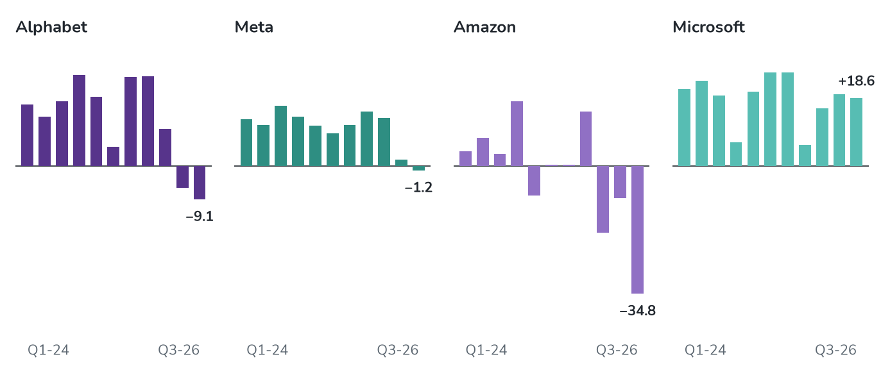
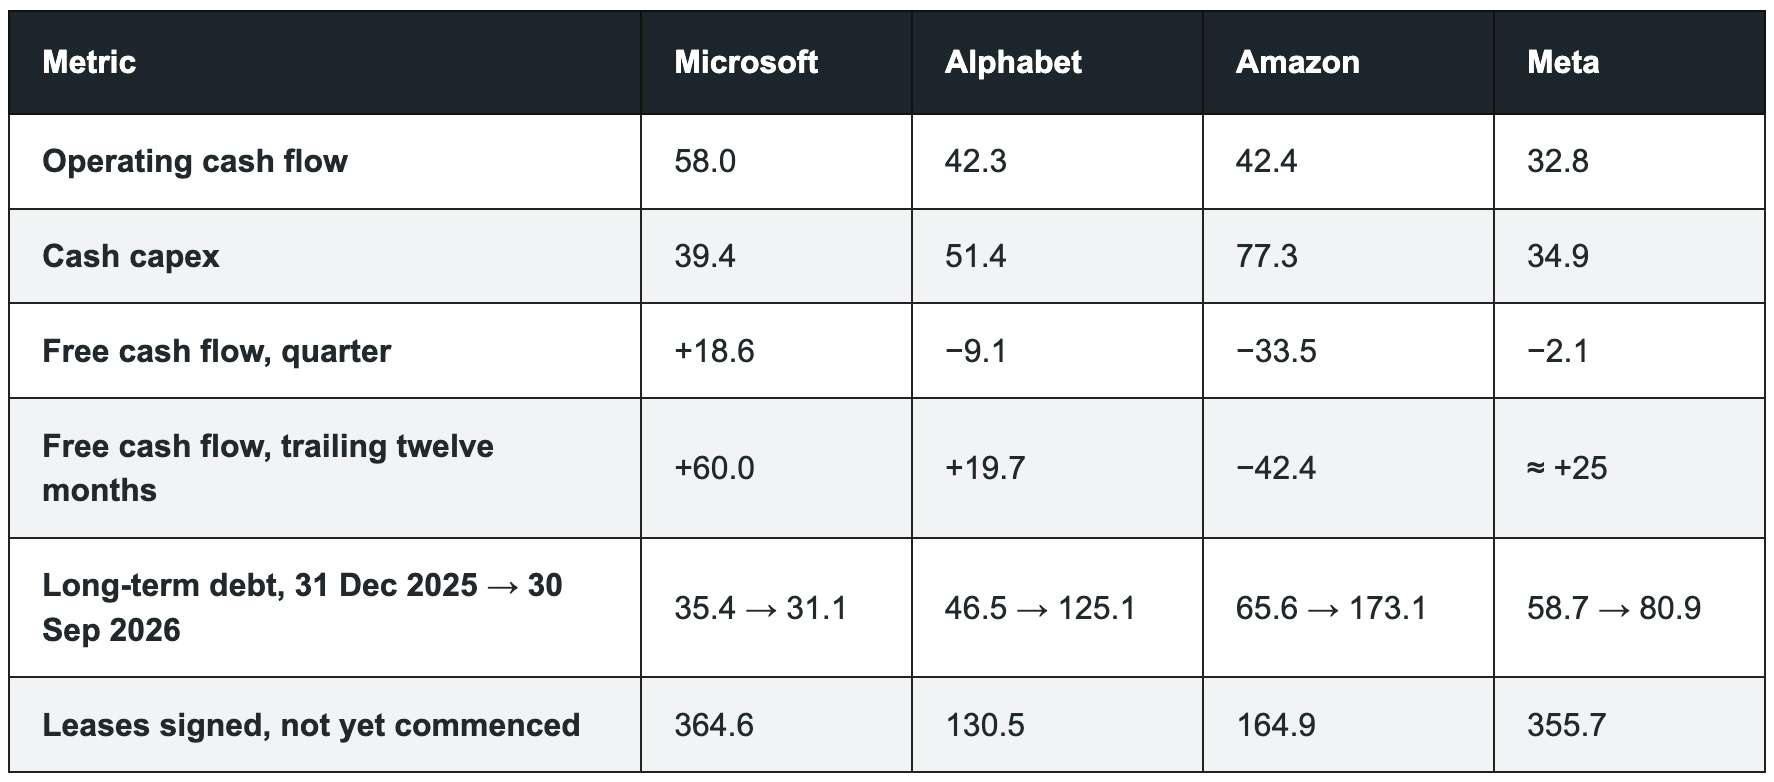
Management all sang the same refrain about constraint: demand still exceeds available capacity, and new capacity is absorbed quickly. Their 2026 capex guides total $720-740bn, based on each company's report: about $220bn at Amazon, $195-205bn at Alphabet, roughly $170bn at Microsoft, and $135-145bn at Meta.
The language on 2027 is more aggressive than the models. Alphabet expects capex to “increase significantly”; Amazon plans to “spend meaningfully more” than $220bn, while projecting AWS growth above 40% in both 2027 and 2028; Meta says it will “continue investing aggressively” but declined to give a 2027 outlook until its fourth-quarter call.
Capital returns and fundraising tell a parallel story. Alphabet raised about $50bn in common and preferred equity in June. Meta announced a roughly $95bn equity program five days after its free cash flow turned negative, while Microsoft continued to return about 70% of trailing free cash flow to shareholders and priced $25bn of bonds on 29 October. The group’s trailing cash flow remained positive, but the quarter’s combined result did not.
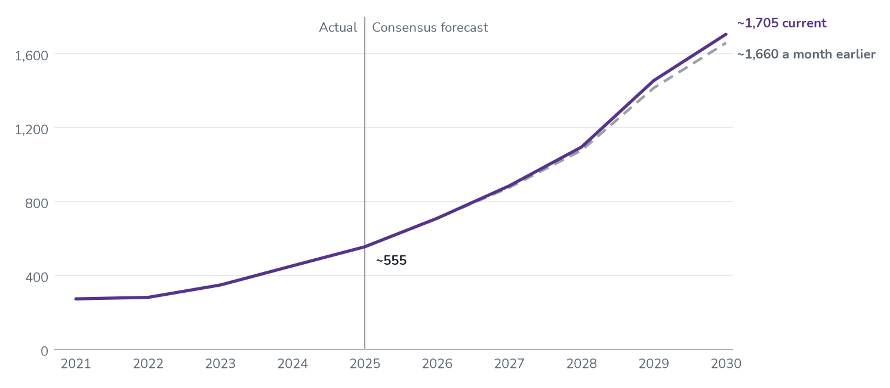
The chart expects the strain to ease quickly. It has free cash flow back above $200bn in 2028 and roughly triples from there by 2030, matching the picture Figure 5 shows for operating cash flow. The companies’ own numbers do not yet show that. Operating cash flow grew about 22% over the first nine months of 2026 at the three calendar-year companies and 34% in Microsoft’s fiscal year, but only 10% for the four in the latest quarter, while capex more than doubled. For 2028 to reach the chart’s +$215bn, cash generation has to keep compounding at close to 30% a year while capex growth drops into the low teens.
Two things suggest capex won't slow that fast: the memory bill, and the fact that the four have already financed the shortfall.
Memory is one reason that slowdown may not arrive on schedule. Bank and industry estimates put memory at 40 to 48% of hyperscaler capex in 2027, TrendForce higher still. On my capex path, that is about $400bn, and most of the 2027 increase is memory, more than half of it price rather than bits. A dollar of capex buys less compute when memory costs rise.
Supply remains tight. SK Hynix says long-term agreements cover more than half its 2027 and 2028 capacity and describes demand through 2029 as effectively sold out. Samsung says its 2027 HBM volume is sold at agreed target prices and expects tight supply in 2028. Higher costs are already showing up in hyperscaler guidance: Amazon cited memory costs when it raised its 2026 capex estimate, and Microsoft said higher memory and storage costs contribute to its second-half acceleration. Apple, on its 2 November call, guided its December-quarter gross margin down “primarily” on “higher memory costs.”
The strongest countercase is a sharp memory-price reversal as new capacity arrives: UBS expects supply and demand to balance by mid-2028. Such a correction could ease the server DRAM and storage bill. But it does not automatically cut the full memory bill in 2028. HBM prices are set ahead, and memory makers and accelerator suppliers negotiated the 2027 terms. A 2028 spot decline may reach the hyperscalers’ HBM costs only when those agreements reset, potentially in 2029; any pass-through also depends on accelerator suppliers. Agentic workloads could push the other way by increasing memory use per unit of useful work, but that remains an untested assumption at rack scale.
Financing changes when the cash line forces a decision. In the telecom buildout of 1996–2001, funding dried up and orders followed. The hyperscalers are raising capital before the shortfall. That can reduce the chance that negative free cash flow alone forces an immediate capex cut, but it does not remove the return hurdle. The constraint shifts toward dilution, borrowing costs, credit ratings, and whether demand continues to justify the spend.
On my path, operating cash flow grows 20% a year from the third-quarter run rate of about $700bn, while capex grows 25% in 2027 and 2028 from the 2026 guides, then 10% in 2029 and 5% in 2030. The four stay around −$130bn of free cash flow in 2028 and −$40bn in 2029, and reach about +$130bn in 2030 only because capex growth has slowed to single digits. If it stays at 25% through 2030, 2030 is about −$330bn. Microsoft, the only one still covering its capex from operations, is the exception throughout. The trough is in 2028, recovery begins in 2029, and cash turns positive in 2030.
AI is testing the businesses that fund the buildout
Four core franchises ultimately pay for the buildout: search clicks, software seats, commerce transactions, and ad impressions. In May, I asked whether agents would move beyond the model layer into the applications that own those relationships. Six months later, the signs are visible, but they do not all amount to cannibalization.
Google said the structural thing out loud for the first time. Search grew 12% to $63 billion, the lowest since the second quarter of 2025 and down from 19% in the first, with query growth that Pichai called the highest in five years. Philipp Schindler attributed part of the slowdown to “the lower monetization we were seeing in AI Mode.” Google did not quantify the gap, and ranked it behind currency and vertical effects as drags on search growth. It argues that much of the activity is incremental and will monetize over time, and is extending ads in AI Mode to new markets and rolling out multi-turn ads in the US. For now, the evidence is a lower near-term yield on some AI-assisted searches - not proof that AI Mode has reduced Search revenue overall.
Reddit shows the distribution risk. Its CEO told analysts that “the reality is the AI Mode does not drive traffic. Not for us, and not to anybody as far as I know.” Reddit’s search referrals fell by more than a million a week in October, and the stock lost 29% the next day, its worst session since it listed.
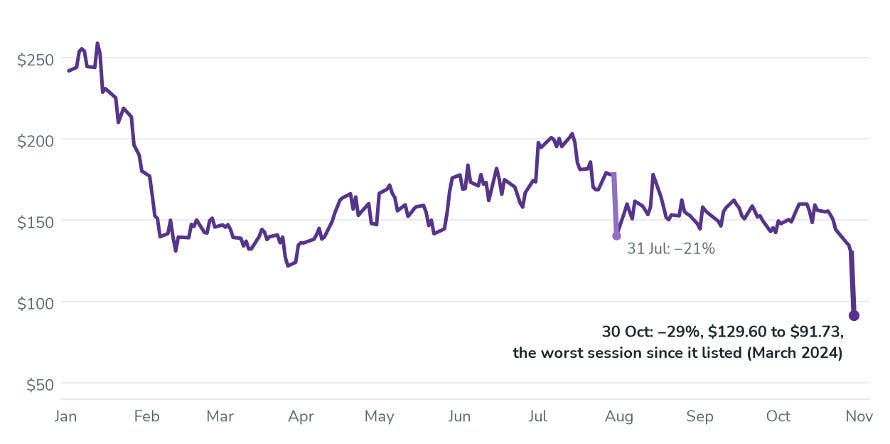
The referral decline and Google’s lower AI Mode monetization fit the same shift from links to direct answers, but they do not establish that AI Mode caused Reddit’s losses or its share-price fall. Google has a monetization problem to solve. Publishers and platforms face the loss of visits.
Microsoft’s change is more managed: the billing model is broadening. Paid Microsoft 365 commercial seats grew 5%, on a count that now includes GitHub seats, down from 6%, amid weaker E3 sales execution. Microsoft 365 commercial cloud revenue grew 18% in constant currency, supported by pricing and higher-value Copilot and E7 bundles. The number of customers consuming Copilot credits on usage billing rose more than 75%, and usage billing became the default for new Copilot Business licenses sold through partners on 1 December. Microsoft says usage pricing will move faster in coding than elsewhere. A second meter is emerging alongside the seat, but the evidence does not yet show the seat being displaced.
Amazon and Meta offer different tests. Amazon’s online-store sales rose 2% and advertising 11%, with comparisons affected by Prime Day timing. Jassy said few customers yet shop through outside agents. Rufus, Amazon’s own shopping assistant, may deepen the existing commerce relationship; for now, the evidence points more to augmentation than replacement. Meta’s ad prices rose 14% and impressions 10%. More than 10 million people in the US and Canada have set up its Muse agent, and Zuckerberg says Meta plans to charge a fee on transactions it helps facilitate. The fee is not live; CFO Susan Li expects the new AI businesses to begin contributing incremental revenue in 2027.
The pattern is uneven:
Google has identified a near-term monetization gap.
Microsoft is adding usage pricing;
Amazon is extending its shopping interface;
Meta is testing a transaction fee.
Where value sits beneath the interface - in Amazon’s fulfillment network or Meta’s attention graph - agents may become another input those systems monetize. Where value depends on the interface itself, as with Search clicks and software seats, the old meter is more exposed.
The question is whether the four can orchestrate agents and charge for the work, or whether AI shrinks the old units of value before new ones take hold.
The hyperscalers are betting on different layers of AI
The capex buys compute. The strategic question is which part of AI each company expects to control and how it will turn that position into revenue.
Six months ago, Anthropic, OpenAI and Google led the frontier, Meta had only just re-entered, and Microsoft and Amazon leaned more heavily on outside models. That map has shifted, but it is not a simple split between owners and renters: Microsoft and Amazon are developing models while building platforms around a wider field of them.
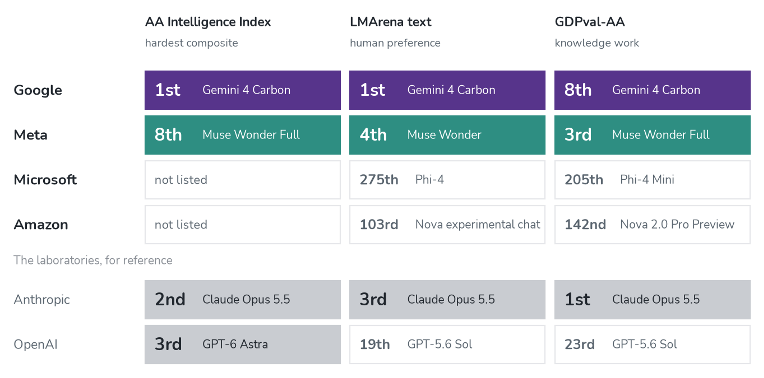
Google has a direct reason to own the answer: as AI responses change the search experience, it needs models that can keep users within its products. Argon took the top of Arena at the end of September, and Carbon, which has since passed it there, took first place on the rebuilt Artificial Analysis index on 28 October, though Carbon is priced but not yet purchasable, and the purchasable Argon sits seventh among distinct models. Google has scale and strong board results: the Gemini app has a billion users, and its first-party APIs process nearly 32 billion tokens a minute, more than four times last year’s rate. That shows capability and adoption, but not yet proof that Google can preserve Search’s advertising yield.
Meta has moved into the frontier race. Muse Wonder, which Zuckerberg called “our first frontier model,” sits fourth on human preference; its Full version is third on knowledge work and eighth on difficulty. It was bought with $135 to $145 billion of 2026 capex and the end of open weights for the flagship. And it makes Meta the only one of the four spending to be a lab and an application at once.
Microsoft’s near-term bet is the layer above the model: Copilot, which routes work to different models. Nadella’s target for Microsoft’s own models is capability comparable to the leaders “within three to six months of their release,” and the moat is built around the harness, where work gets done: ninety percent of Copilot queries use Auto mode, which routes each task across models, and Nadella says coding-agent users want the labs to “compete for your workload, not once a quarter but for every task“. This is orchestration in practice: choosing a model for each task inside a product where the work gets done. It also leaves Microsoft exposed to OpenAI, both a major model supplier and a major counterparty.
Amazon is building a marketplace around models and its own chips. Nova went unmentioned on the call, while Bedrock’s token volume grew nearly seventeen fold in a year, mostly on Trainium: Amazon sells other companies’ models on its own silicon.
The distinction is not between companies building models and companies that do not. Google and Meta are pushing to own more of the model layer; Microsoft and Amazon are emphasizing the systems that route, host, and run models, even as they develop their own. Neither position guarantees a return on capex.
The next question is whether the labs whose workloads fill these platforms can pay for the compute they have committed to buy.
Why the cash-flow recovery may wait until 2030
The sections above change how I read the recovery curve. The Financial Times chart, based on Bloomberg consensus before August, showed the four companies’ free cash flow bottoming at +$60bn in 2027 and reaching about +$640bn by 2030. That curve is no longer current. On the third-quarter run rate, the four generate about $700bn a year from operations and spend about $810bn on capex, a shortfall of roughly $110bn a year before any growth, while the chart shows +$65bn.
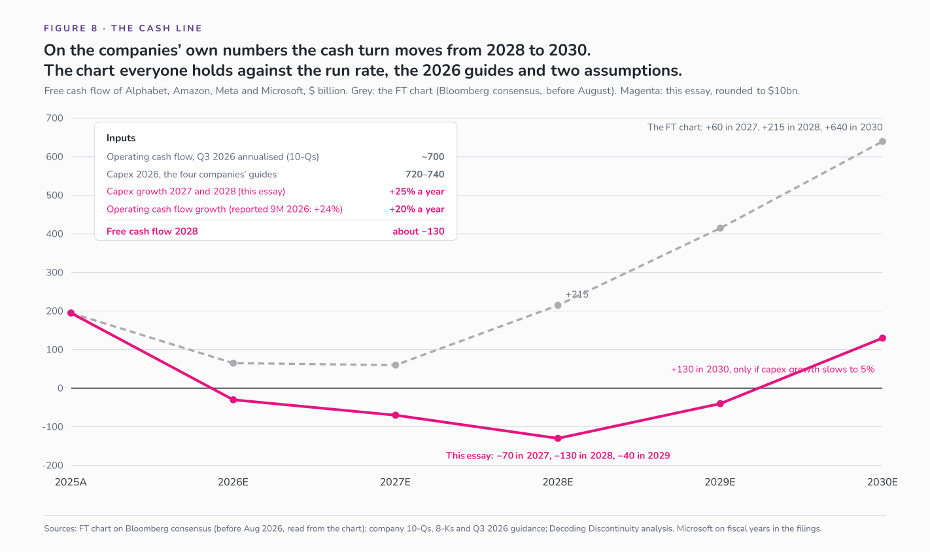
Two assumptions separate my path from the chart. The first is capex: I take the companies at their word and let it grow 25% a year through 2028, when the chart needs it to flatten. The second is cash generation: the chart needs operating cash flow to compound at close to 30% a year for two years, whereas the companies reported 24% over nine months and 10% in the latest quarter, with Alphabet’s down 13%. No company has given a figure for 2027 capex; the first section showed why the memory bill does not ease quickly and why a cash shortfall alone will not force a cut.
My path rests on two assumptions.
I set capex growth at 25% a year in 2027 and 2028 from the 2026 guides, which is what the words on the calls, the quarter’s run rate, and the memory contracts imply, and operating cash-flow growth at 20% a year from the current run rate, below the roughly 24% the companies reported for the first nine months of 2026. On those two, 2028 free cash flow is about −$130bn against the chart’s +$215bn. At the 22% the three calendar-year companies reported for nine months, 2028 is about −$100bn; at the 29% Microsoft reported for its quarter, about +$20bn. The sign of 2028 turns on whether cash generation runs at the three calendar-year companies’ rate or Microsoft’s; capex at 25% is common to all three cases. The 20% rate is my judgment, reflecting disclosed margin pressure from rented capacity and energy, alongside risks to the core businesses that fund the buildout. The evidence of weaker monetization is clearest at Google; it does not yet establish a uniform slowdown across all four.
The strongest countercase is a sharp memory-price decline. If DRAM contract prices fall by a third or more inside 2028, capex comes in flat, and the chart’s inflection arrives on time. I put that at about one chance in three, and the first readable sign is TrendForce’s contract guide around the turn of the year.
Model rankings do not change this arithmetic. But they do shape where the return on capex might accrue. Google and Meta now own frontier models and bear the full compute cost that produced them. Microsoft and Amazon mostly host others’ models, and their capex bets on volume routed through their clouds rather than on their own models. Operating cash flow isn't simply contracted backlog: it depends on customers using the capacity, paying for it, and leaving enough margin after costs.
The final question is whether the labs behind a significant share of cloud commitments can turn those commitments into cash. That is where the next section goes.
OpenAI and Anthropic put cloud backlogs to the test
Cloud growth remains strong: Google Cloud grew 103% in the third quarter, Azure 48% and AWS 39%. The three providers report roughly $1.8tn in backlog, but the measures differ: Google reports Google Cloud remaining performance obligations, Microsoft reports commercial RPO—not cloud alone—and Amazon reports AWS backlog. On what the companies have disclosed, commitments from the two laboratories equal close to two-fifths of that total: Anthropic’s $276bn of commitments to the three clouds in its prospectus, OpenAI’s $138bn at AWS in Amazon’s 10-Q, and the 45% of Microsoft’s commercial backlog that Amy Hood attributed to OpenAI in January, together about $700bn. On the 10-Qs and the prospectus alone, without Microsoft’s call figure, it is just under a quarter. These are concentration estimates, not a claim that all the backlog is at risk.
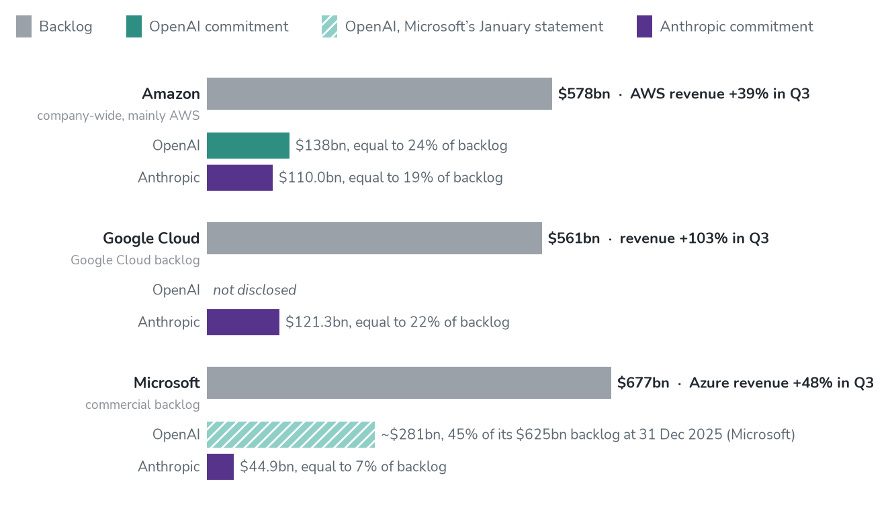
Anthropic’s amended S-1, filed on 2 November, puts numbers behind its cloud relationships. It discloses minimum commitments of $121.3bn to Google, $110bn to Amazon and $44.9bn to Microsoft, and up to $120.5bn to SpaceX, cancellable on 90 days’ notice from early 2027. The three cloud agreements total $276.2bn. The filing’s broader $895.4bn of committed spend includes other compute and infrastructure arrangements and leases; $447.5bn is expected before the end of 2030, including $69.8bn in the next twelve months.
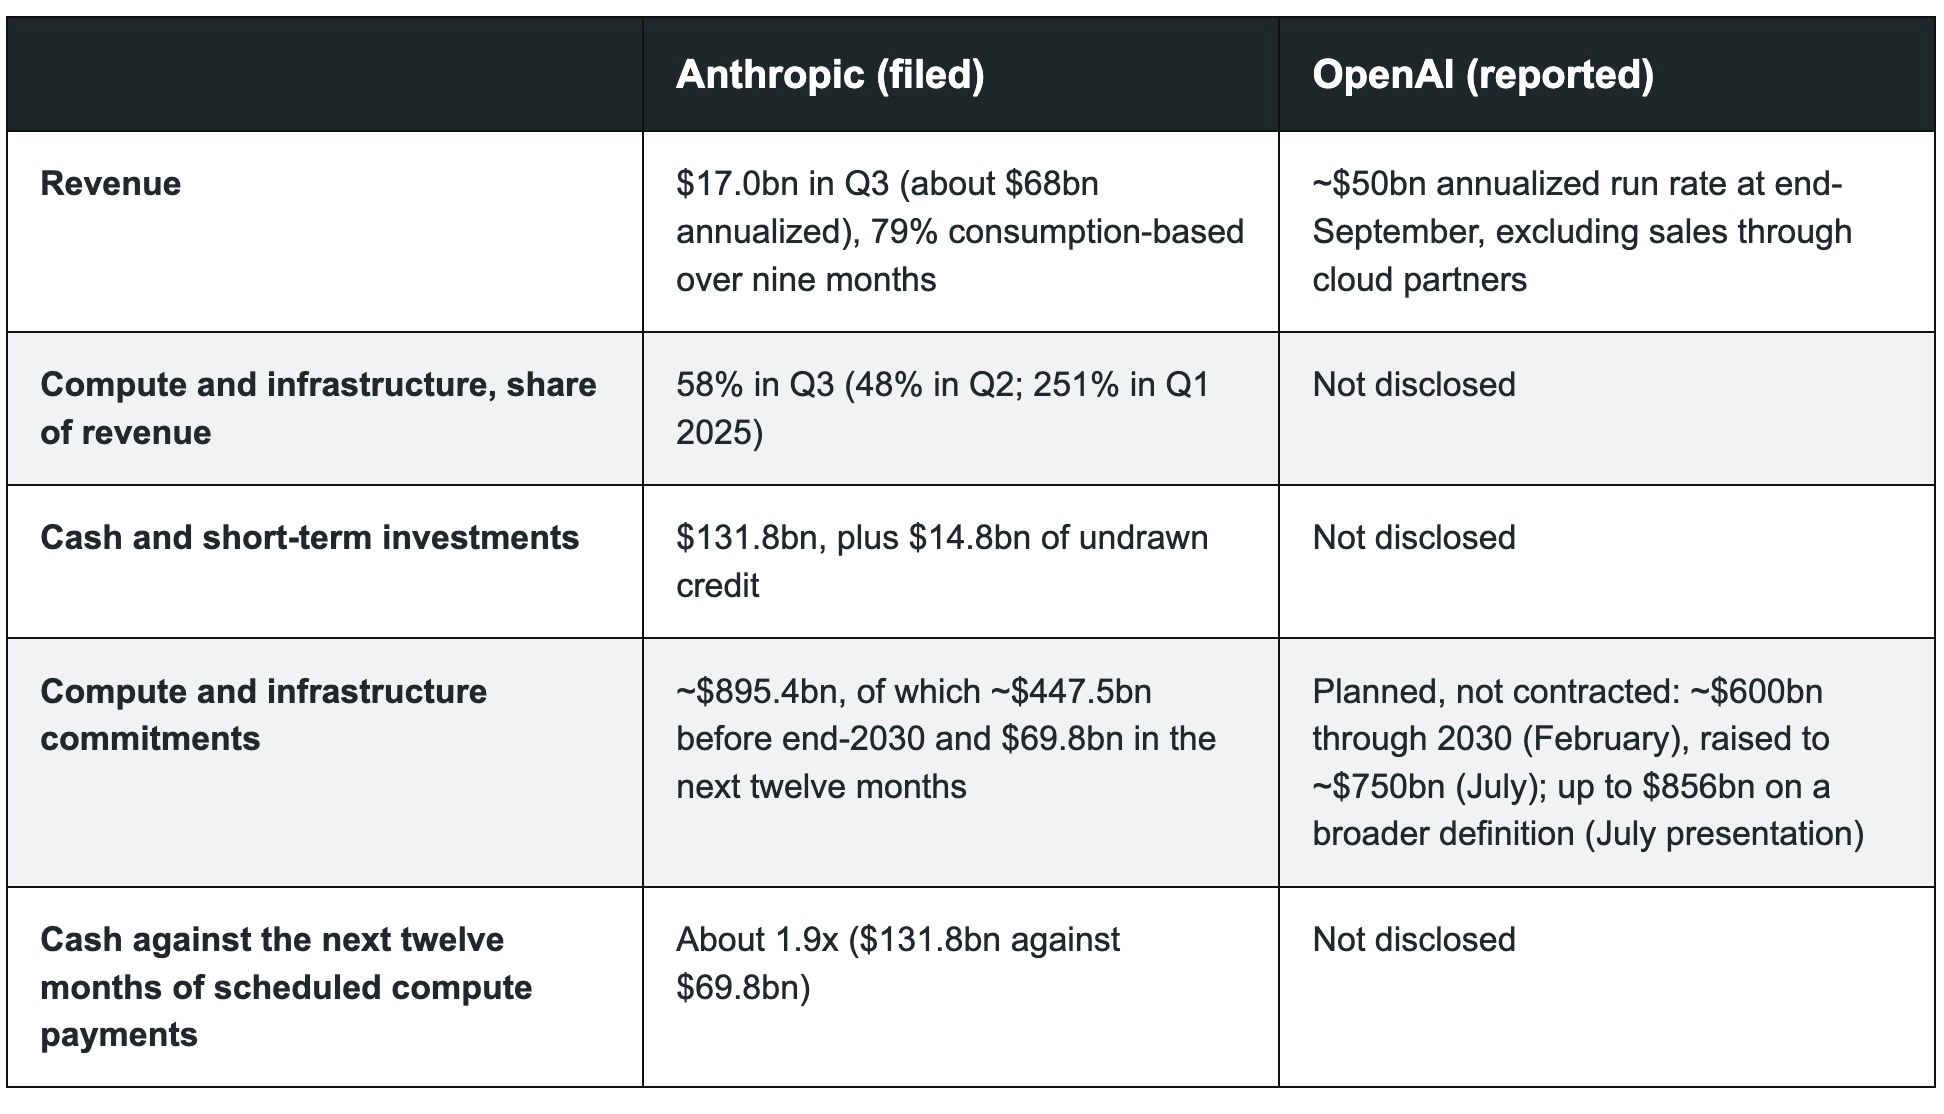
Anthropic’s near-term liquidity looks stronger: its disclosed cash and short-term investments are about 1.9 times the next year’s scheduled compute payments. But compute and infrastructure costs reached 58% of Q3 revenue, and the filing shows commitments extending well beyond 2030. Anthropic has also begun leasing chips directly and hosting them in dedicated facilities operated on its behalf, raising the possibility that some capacity could move in-house. Meanwhile, 44% of its revenue in the first nine months of 2026 came through cloud marketplaces, up from 11% in 2023. The cloud providers collect marketplace fees and sell compute, but their growth is increasingly tied to the labs’ ability to keep growing.
OpenAI is less transparent. Its roughly $50bn annualized revenue figure is a reported run rate, not quarterly revenue. A July plan reported by the Financial Times projected $278bn of cumulative negative free cash flow through 2030 and up to $856bn in compute and infrastructure spending, on a broader definition than earlier estimates. OpenAI has not disclosed a comparable twelve-month payment schedule, so its cash coverage and the timing of any new capital raise remain estimates.
The exposure differs by provider. Microsoft recorded $10bn of revenue from OpenAI in Q3 and had $7.2bn in receivables, but has not updated OpenAI’s share of its $677bn commercial RPO. Amy Hood’s January figure, 45% of $625bn, is now only a reference point; my estimate puts the share between one-third and two-fifths.
Amazon’s Q3 filing marked its Anthropic preferred shares and convertible notes at a combined fair value of about $238.7bn after $18bn invested. That is an accounting mark, not cash returned. Google and Amazon have also made up to $35bn of additional note financing available to Anthropic, $20bn from Google and $15bn from Amazon, the latter released on compute milestones. Google’s separate $128.2bn figure for non-marketable equity securities is company-wide; it does not identify Anthropic’s share. OpenAI exposure at Oracle is also significant by outside estimates, but Oracle is beyond the three-cloud backlog comparison here.
The financing loop is clear: the hyperscalers invest in or finance the labs, and the labs spend heavily on compute from those same providers. But the risk is concentrated, not universal. My estimate is that the two labs account for a large minority of reported cloud backlog, and their credit profiles differ: Anthropic has substantial liquidity against rising obligations; OpenAI’s funding needs are less transparent and depend on reported projections. Backlog becomes cash only as capacity is delivered, customers use it, bills are paid, and margins hold.
The question is how much of this concentrated demand converts on schedule—not whether the whole $1.8tn is in doubt.
Signals to watch: what could change the 2030 case
The hyperscalers can finance the buildout. That does not guarantee the cash recovery their valuations assume. In my central case, the four remain about $130bn cash-flow negative in 2028 and about $40bn negative in 2029; a return to positive free cash flow in 2030 depends on capex growth slowing to single digits, or cash generation holding the rate reported this year. Memory costs, pressure on core businesses and the labs’ ability to meet their commitments all shape whether that path holds.
This is the larger wager behind the AI boom: capital is funding an infrastructure whose economic value has yet to settle into place. The winners will be the companies that turn compute into useful work and capture enough of that value to pay for the buildout.
The capex is funded; the return is not. Whether these companies can bridge that gap will have financial and economic consequences that echo far beyond the companies that form AI’s inner circle.
Disclosure: Decoding Discontinuity is the research behind the author’s investing. The author holds no position in Anthropic or OpenAI. The author manages a fund that may hold long or short positions in listed companies discussed in or affected by this essay. This essay uses only published sources and is not an offer, solicitation, or recommendation regarding any security, including any offering by Anthropic.
Thoroughly enjoyed reading this, thanks